How to link Pancard with Aadhar card Online Free|Last Date 30 June 2023|
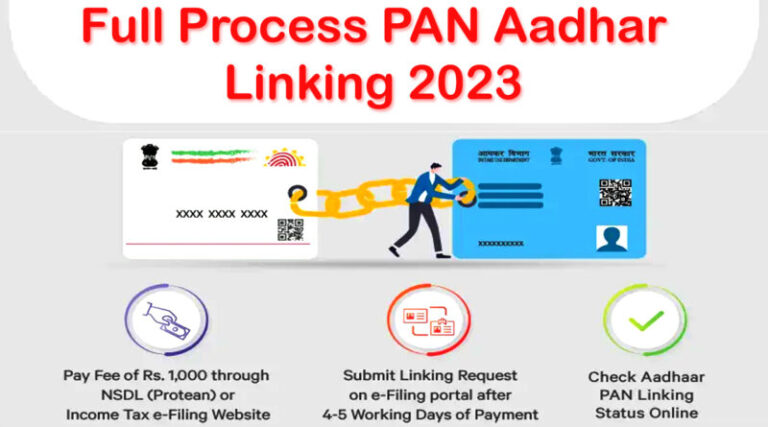
How to link Pancard with Aadhar card Online? I can provide you with general guidance on how to link your PAN card with your Aadhaar card online. …
How to link Pancard with Aadhar card Online? I can provide you with general guidance on how to link your PAN card with your Aadhaar card online. …
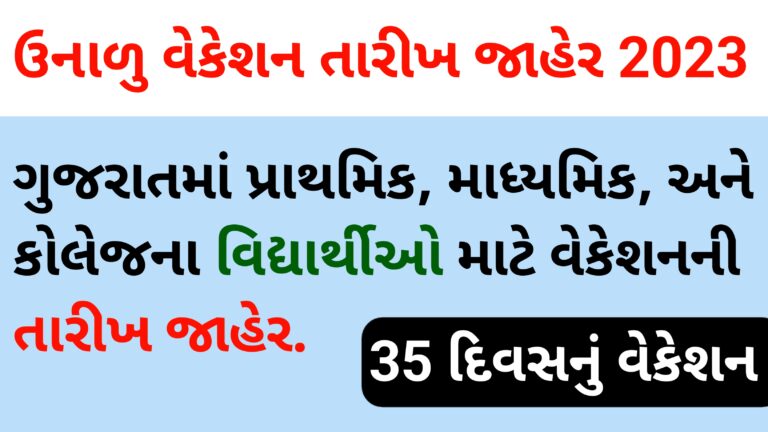
All primary schools and school groups in the state display the high school affairs calendar published by the Board of Gujarati and Literary Education every year. According …

03To inform the principals, teachers, administrative staff, parents and students of the higher secondary schools of all science streams in the state recognized by the Gujarat Board …
Std 10 Gujarati Paper Set Board Exam March 2023 BOARD EXAM OLD PAPER PAPER SET 1 PAPER SET 2 PAPER SET 3 PAPER SET 4 PAPER SET …
Introduction: The Page Setup dialog box in Excel is a tool that allows you to customize various aspects of how your worksheet will appear when printed. It …
Introduction: A chart in Excel is a visual representation of data that helps users understand and interpret information more easily. It presents data points, trends, and patterns …
Parts of the Excel screen:

ધોરણ 9 ધોરણ 10 ધોરણ 11 ધોરણ 12 દ્વિતીય પરીક્ષા 2023 પેપર સ્ટાઇલ પરીક્ષા કાર્યક્રમ અને જુના પ્રશ્નપત્રો. દ્વિતીય પરીક્ષા તમામ સંકુલ અને શાળાઓના પેપર ડાઉનલોડ કરવા માટે એક ક્લિક કરો. …
Std 12 Science, Commerce, Arts Second Exam Paper January 2023 Compulsory examination will be held in all schools on 27th. Unit test of 9th to 12th will …
Std 11 Science, Commerce, Arts Second Exam Paper January 2023 Compulsory examination will be held in all schools on 27th. Unit test of 9th to 12th will …